Why Assessing the MBTA Communities Act Is More Complicated Than You Think
New GSD research shows that compliance with the Massachusetts transit-linked zoning law is both more widespread—and more nuanced—than is often depicted in the media.
In a packed Marblehead town hall last month, the usual choreography of a New England public hearing was briefly interrupted by a man in a hoodie. After listening to a long, technical presentation on the town’s response to the MBTA Communities Act, David Modica stood up and asked, in plain language, what everyone else had been circling around: “Like, are we trying to do nothing? Because it seems like we’re doing nothing.”
The town was voting to put most of its required multifamily zone over an existing golf course that is unlikely to be developed as housing. He continued, “We’re trying to make sure we build no houses? Are we kind of being pricks?” His questions, delivered with disarming candor, cut to the heart of the law’s central tension: that a community can fully comply on paper—by checking every box, submitting every map—while never really intending to build new housing. The scene was illustrative of exclusionary attitudes in communities across the country that prevent development, especially of multifamily housing that is typically occupied by renters.
The Massachusetts Communities Act, implemented in 2021, requires 177 cities and towns, served by or near the Massachusetts Bay Transportation Authority (MBTA), to create at least one zoning district where multifamily housing is allowed by right, at a minimum density, without age restrictions. If you have followed the headlines, you might think the story of the law is mostly about a handful of angry suburbs, such as Milton, refusing to comply, or doing the bare minimum. It is not uncommon in housing journalism to put the emphasis on the openly exclusionary places. High-conflict, high-income, high-opposition towns make for clickable stories: angry residents, heated hearings, lawsuits, dramatic quotes.
This unbalanced coverage can distort our sense of how the law is actually being implemented across all 177 municipalities. Our research shows that when you step back from these few loud suburbs and look systematically across the map, a very different picture emerges.
First, it is important to note that the act is zoning reform, not a construction mandate. It is intended to create capacity for housing, but does not force towns or developers to build, or even to put their zones in areas that are likely to be developed. This matters, because it is one of the most ambitious statewide attempts to push exclusionary suburbs to legalize multifamily housing near transit. Our ongoing research looks at what the MBTA Communities Act did, how towns complied with the law, and what that potentially means for housing development.
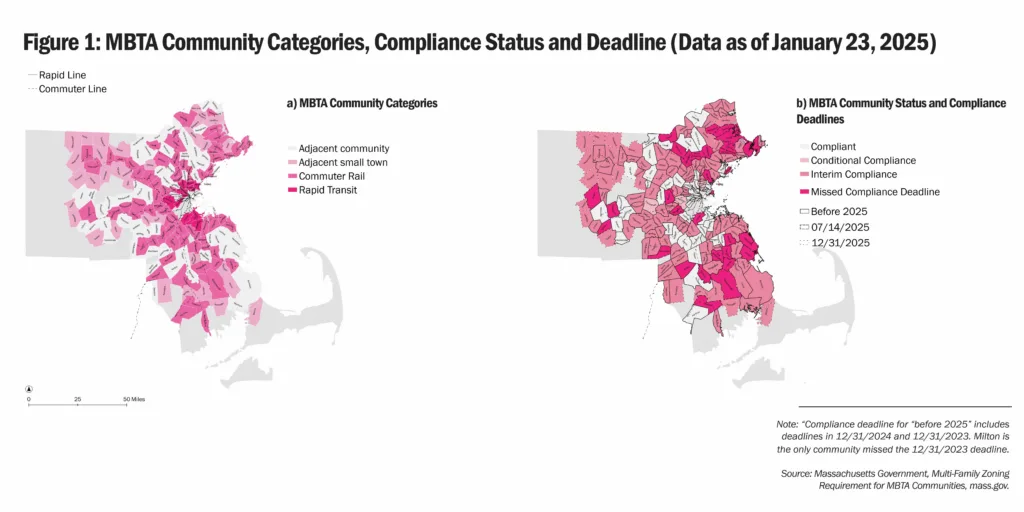
What this compliance map does not show is the category of “paper-compliant” towns, those that did not have to do too much to authentically comply with zoning capacity requirements as stated by the law. There are nine of them: Salem, Cambridge, Fall River, Framingham, Havervill, Lakeville, Northbridge, Rochester, and Worcester. The map also does not distinguish the towns like Marblehead that were “silently noncompliant;” they seemed to comply, but put their districts over land uses that are unlikely to develop housing.
In our analysis, which echoes Amy Dain’s paper compliance commentary, as well as Kathy Einstein and Max Palmer’s preliminary analysis on 3A compliance, we are studying variations in how communities approached the mandate, implementation on the ground, as well as construction outcomes post-compliance. We are less interested in a simple binary (complied versus did not) and more in the variation in how towns complied and what that implies for future multifamily housing construction.
To understand that variation, we found that the usual binary story (good actors versus bad actors is not enough. Instead, we look at the Greater Boston metro region through four distinct categories:
- the non-compliers/resisters: openly defiant and delayed or refused to comply (e.g. Milton);
- the bare-minimum compliers: technically compliant but created minimal capacity by designating zones in inconvenient locations or over existing land uses that are unlikely to translate into new housing (e.g. Marblehead);
- the already-compliant: met the minimum requirements of the law with existing zoning because they already had somewhat permissive regimes (e.g. Salem);
- the super-compliers: used the law as a lever to significantly upzone, embrace multifamily housing, and push for meaningful change, even if there was eventual backlash (e.g. Lexington).
These additional categories matter. They pad the “compliance rate” without producing any additional, realistic capacity for housing development beyond what already existed. While the places that resisted compliance get substantial attention, we were interested in the places that complied early, and conducted fieldwork in two of those towns: Salem and Lexington. Both were part of the first cohort targeted by the law, and were deemed compliant by the Healey-Driscoll administration on December 12, 2023.
Salem fits in the “already compliant” category; it did not make significant changes to its zoning, but, unlike Marblehead, this was because those districts already existed, not because it was trying to prevent additional housing development. The town’s long-standing planning work and a more pro–infill political climate means the MBTA zoning looks more like an incremental extension of existing transit-oriented priorities than a sharp break. Compliance was a natural extension of prior commitments. In other words, Salem complied, but without having to work too hard for it.
Meanwhile, Lexington falls into the last category, using the law as a push to open the community for development, despite subsequent backlash after the districts were approved. Lexington went above and beyond the requirements of the law to push for more density and new, multifamily construction, leaning into the spirit of the mandate. Fierce community pushback ensued, creating post-compliance challenges that included fights over specific projects and further zoning revisions. However, even the short window of expanded multifamily zoning allowed several projects to get underway, with a substantial pipeline of multifamily proposals (amounting to more than 1,000 units). Lexington was a super-complier but ultimately paid a higher political price for it, resulting in organized attempts to roll back the zoning, contested town meeting votes, and a lingering sense that MBTA compliance remains a live, polarizing issue rather than a settled one.
Salem and Lexington show two very different stories of early compliance. The comparison of these towns raises longer‑term questions about how each community will live with the physical and political outcomes of having moved first. But, both become more interesting when set against the broader landscape of 177 municipalities. Yes, formal compliance rates are high, but “high compliance” hides huge variation. Our research allows us to critique the assumption that what appears to be high compliance immediately means success.
A more expanded view of compliance that fully captures the different planning processes and approaches of towns like Milton, Marblehead, Salem, and Lexington reveals much more about the benefits and limits of a state zoning reform mandate. Without a requirement to actually build, to upzone new areas, or to designate districts where development is likely, high compliance could still mean very little new housing capacity is added in practice. Nevertheless, the mandate has forced towns to have these conversations and to wrestle with their role in the broader housing supply shortage and affordability crisis that Massachusetts faces.
Zack Lively and Teresa Li contributed to mapping.