Why Policy Needs Architects
From new housing production to adaptive reuse, effective policy depends on understanding how buildings actually work.
The zoning code has long been the primary policy target for planners seeking to increase housing production. More recently, however, cities that have already enacted meaningful zoning reform have discovered that other regulatory frameworks—most notably state building codes—also shape the building types and project scales that developers chose to pursue.
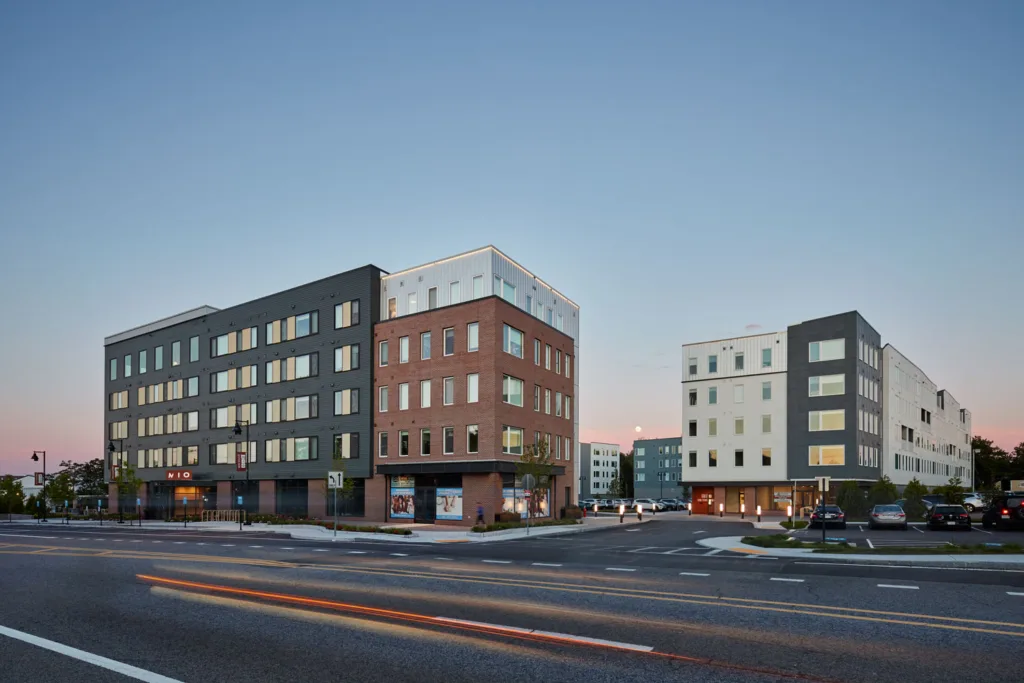
I was first made aware of the disciplinary divide between architects and planners, when it comes to policy that impacts the built environment, a few years ago when I joined several architects to pitch a research project on the impact of egress stair requirements on housing typologies to Chris Herbert, managing director of the Joint Center for Housing Studies at Harvard. While not quite as dramatic as St. Paul’s conversion on the road to Damascus, Herbert became increasingly intrigued by the role that non-zoning regulations play in shaping market preferences and development outcomes. His enthusiasm for the topic ultimately led to the research report Legalizing Mid-Rise Single-Stair Housing in Massachusetts, which has since become a foundational document in a growing advocacy movement across North America.
This application of architectural thinking to policy questions has extended to other projects colleagues and I have undertaken. One example was our work developing a new zoning framework for Newton, Massachusetts, a largely prewar suburb of Boston with multiple commercial village centers. A key objective of the new code was to encourage the adaptive reuse of the large Victorian houses located near these centers, which were expected to face intense redevelopment pressure once as-of-right zoning was adopted.
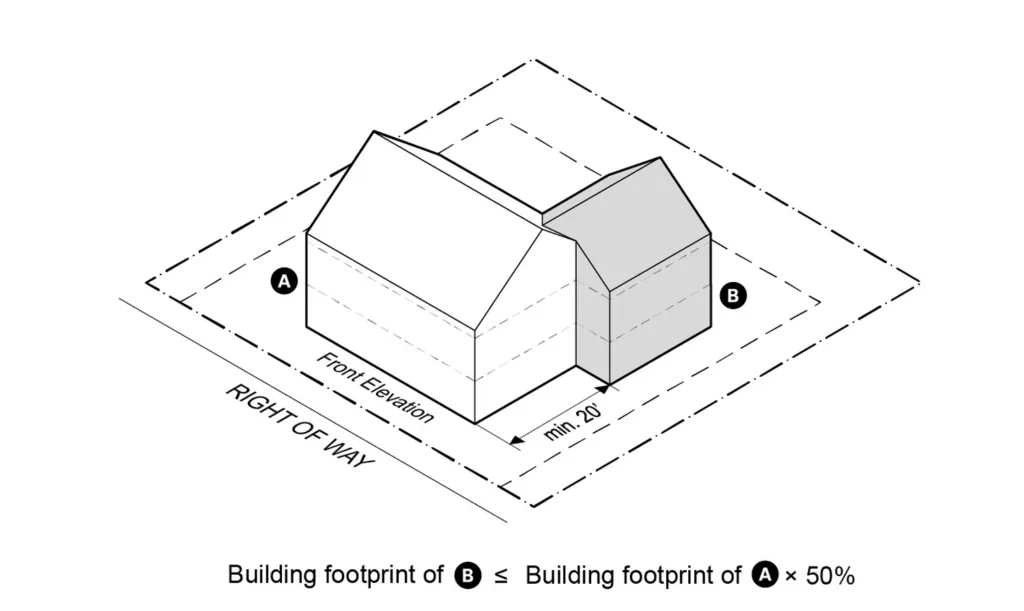
Our solution was to limit new development in the Multi-Residence Transit (MRT) District to a maximum building footprint of 1,500 square feet and four units per lot while creating incentives for the reuse of existing structures by allowing generous additions and increasing the unit cap to six. To ensure that additions remained subordinate to the original buildings, the footprint of any addition was capped at 50 percent of the existing structure, and additions were required to be set back at least 20 feet from the primary façade. To calibrate these standards, we tested numerous scenarios across a range of existing building types and lot configurations. In other words, architectural thinking was placed directly in the service of policy reform.
A second example emerged from our work with the City of Boston as planners began exploring policy tools to encourage the conversion of underperforming office buildings to residential use. Our first assignment was to estimate how many buildings—and therefore how many potential housing units—could be unlocked through a generous tax-abatement program.
To develop a defensible estimate, we created a GIS-based analysis of the typical upper floor of every building in Downtown Boston by slicing through the city’s three-dimensional building model. The upper floors were used because they generally represent the “typical floor plate” on which redevelopment feasibility analyses are based. Drawing on our knowledge of residential building design, we identified buildings with floor plates capable of accommodating a double-loaded corridor, generally requiring widths between 55 and 70 feet. We also identified a few center-core commercial buildings with lease spans less than forty feet, and therefore viable for residential conversion.
Using these parameters, we developed a screening methodology that identified an initial pool of candidate buildings. We then eliminated properties lacking windows on both long sides of the floor plate due to party-wall conditions and removed buildings with floor plates smaller than 7,500 gross square feet. While some of these smaller buildings might have been physically convertible, most institutional and conventional capital sources have little interest in financing projects below that scale.
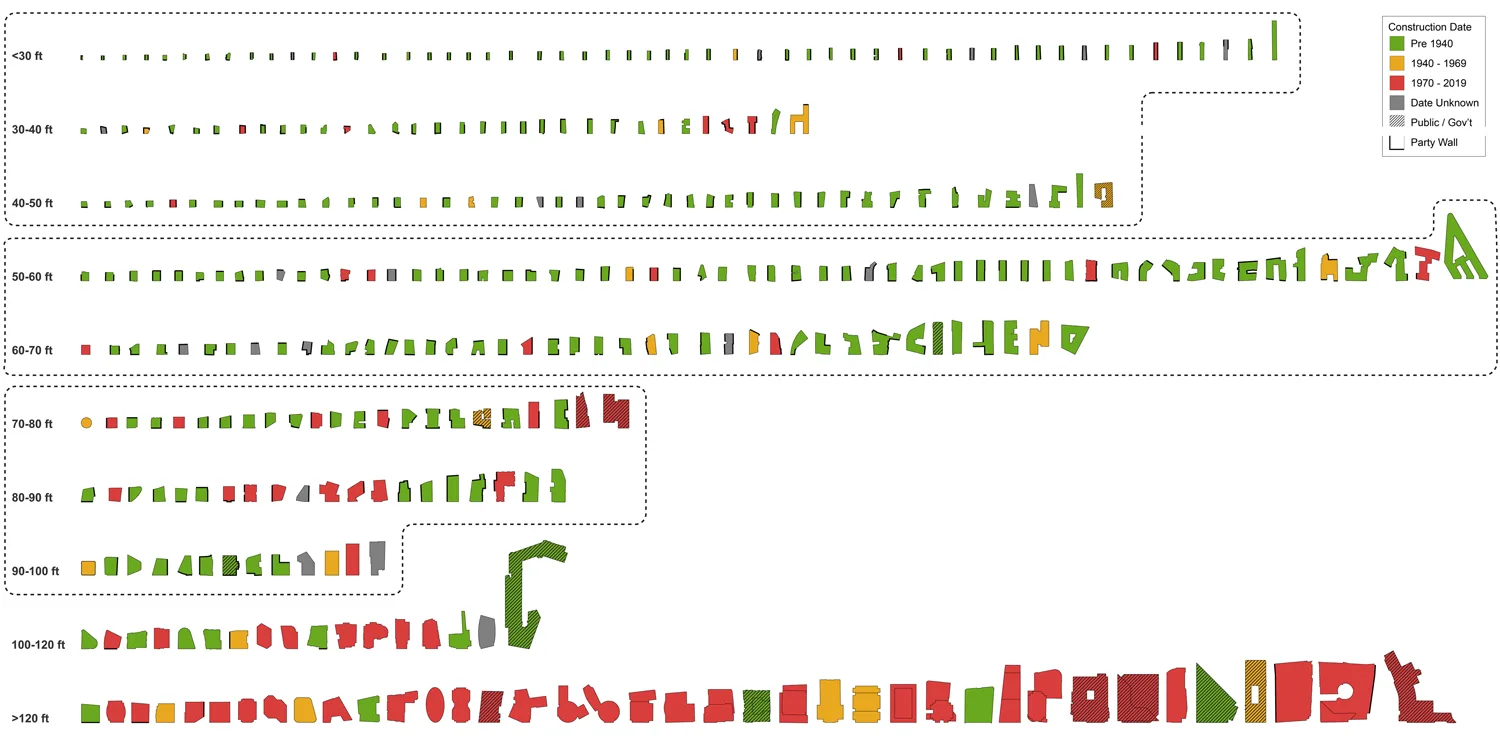

The analysis ultimately identified 55 buildings as viable conversion candidates. These properties were mapped and color-coded by age, while their typical floor plates were organized into a comparative matrix based on size. The combination of aggregate development potential and the geographic distribution of eligible properties helped convince city officials that a tax-abatement program was worth the associated political and fiscal costs. Armed with a list of viable candidates, Boston’s economic development staff was then able to engage directly with property owners to assess redevelopment interest and discuss potential incentives.
As in the Newton example, specialized architectural knowledge proved essential to evaluating the likely effectiveness of a policy intervention. Without an understanding of how buildings actually function, many of the key assumptions underlying the analysis would have been impossible to test.
The broader lesson from these examples is that architects should play a much larger role in the development of public policy, particularly when policy goals involve the adaptive reuse of existing buildings. At the same time, the regulatory frameworks that shape new development—including zoning ordinances and building codes—would benefit from greater engagement by architects and urban designers. Without their participation, planners will continue to make policy with only a partial understanding of the physical outcomes those policies are likely to produce.