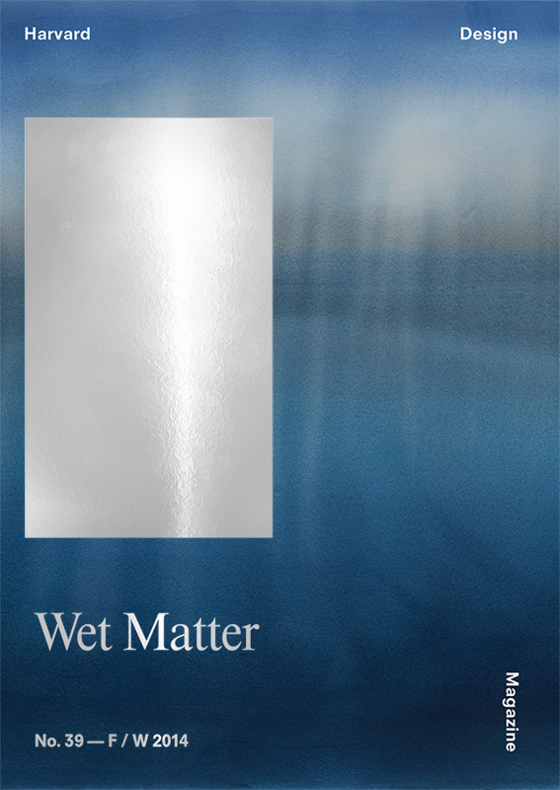
Xiaowei Wang

You’re Chief Scientist at the Environmental Systems Research Institute (Esri), in Redlands, California. As a geologist and oceanographer, can you briefly describe your journey?

Dawn Wright

As a graduate student in the geography program at UC Santa Barbara I became involved with some of the professors in the geological sciences department. Professor Rachel Haymon had just returned from a month-long expedition to map underwater hot springs on the East Pacific Rise, with the same vehicle that had been used to discover the Titanic a few years earlier. She had stored some data in a geographic information systems (GIS) export format, but had no idea how to turn that into an actual map. I expressed interest in her project and she took me on.

XW

You learned GIS on the fly?

DW

Yes, and that relationship continued when I joined the faculty at Oregon State University. Later, when Esri cofounder Jack Dangermond considered bringing someone on as Chief Scientist, I knew Esri well as both a user and a collaborator. I was honored to accept his offer, which included leading a new initiative to better apply Esri technology to the mapping and analysis of the oceans.

XW

How far have we come since Marie Tharp’s contribution to the famous 1977 World Ocean Floor Panorama?

DW

I highly recommend the recent book Soundings by Hali Felt, who describes how Marie Tharp and Bruce Heezen developed the first map of the ocean floor, partly in collaboration with an Austrian landscape painter Heinrich C. Berann. Marie actually discovered the rift valley of the mid-ocean ridge system, which had important implications for the viability of plate tectonics as a theory. But, as a female scientist in the 1950s and 1960s, she wasn’t given credit for her ideas.

XW

Were there holes or gaps in the data?

DW

Yes, it took a lot of extrapolation to make the 1977 map. The cartographic beauty masked a lot of the inaccuracies. But to this day, it’s still the map for many of us who map the sea floor and for other kinds of oceanographers. It lends credence to the impact of beautiful, accurate, cartography done well with the best available data. And that impact is huge.

XW

How far has mapping the oceans evolved since Tharp’s work?

DW

Today, our maps are of course much more detailed and accurate, as we have more ways to collect data. Esri’s aim in developing its Ocean Basemap is to provide the modern-day equivalent of the 1977 map with even more authoritative bathymetric data, as well as ocean floor feature names, water body names, and, in certain regions, derived depth values.

Anyone can contribute their high-quality, high-resolution data to the Ocean Basemap, which is a foundation for ocean GIS. Individuals or organizations involved in ocean science, ocean conservation, maritime operations, or ocean management can deploy GIS feature overlays or web services, such as maritime boundaries, energy infrastructure, shipping activity, subsurface geology, ocean surface and water-column observations, nautical charts, etc., to dynamically mash up those layers with our bathymetry.

XW

Satellites can do quick scans—can we do the same for oceans?

DW

Satellite sensors that scan the earth are amazing, but they cannot see all the way through the water in most areas of the oceans. We do have a low-resolution global map of the ocean floor that comes from satellites, but it’s an approximation based on bumps in the ocean’s surface that reflect the earth’s gravitational changes—that is, where the largest mountains and trenches are.

Oceans are very different. Since we don’t have acoustics from space satellites—yet!—we have to use acoustics from ships and vehicles instead, similar to the way marine mammals navigate and communicate. By sending sound waves into the water, we can make wonderfully detailed maps. It just takes longer to get detailed information. At sea we gather data on average at the speed of a bicycle, 10 to 20 miles per hour; in comparison, low-earth orbit satellites travel between 10,000 to 15,000 miles per hour, circling the earth two, even three times a day.

XW

Can data come from other places?

DW

Yes, absolutely—from a wide variety of local and regional jurisdictions, and at different scales and resolutions—even from crowd-sourced data.

XW

How is that possible?

DW

Given the appropriate sensors, everyone from local fishermen to university programs funded by the National Science Foundation or the US Navy can collect bathymetry.

XW

What political questions does data bring up in relation to mapping and the future of marine spatial planning, especially with recent disputes about islands in Asia and ocean zones in the Arctic?

DW

How should the oceans be used and by whom? This is where marine spatial planning factors in. One major objective is to make sure that everyone is at the table, so that it’s not just government making top-down decisions about offshore uses for a given area, but citizens, conservation groups, and small or large industries that are dependent on the oceans. GIS can truly bring these stakeholders together, face-to-face or online, looking at the same data, and sketching alternatives in a fully collaborative way.

XW

Is ocean governance similar to Internet governance and the Wild West of the web?

DW

In some areas, jurisdictions and governance are clear. For instance, all US coastal zones have a state territorial sea extending from the shoreline out to 12 nautical miles. And under federal jurisdiction, the National Oceanic and Atmospheric Administration is exploring new areas for offshore parks and new national marine sanctuaries, which is similar to planning a traditional park but with a twist. Governance on land is a bit more straightforward because boundaries are static. Oceans are different because they are constantly in motion and the “boundary line” is three-dimensional.

XW

The boundary line?

DW

Yes. Ocean boundaries can be difficult to understand and enforce, because they extend down from the sea surface to the sea floor, forming a three-dimensional volume. On land, a boundary is defined with a distinct line on a map and in some places a visible property division. But with marine spatial planning, maps typically show boundaries only at the ocean surface or the shoreline in two dimensions rather than three. People rarely think about space or property in terms of volume, but that’s the reality of oceans. Few people even realize that the United States has an offshore boundary, but it’s truly an ocean nation. We actually have more ocean surface area than land surface area, if we count our National Marine Sanctuaries and marine reserves.

XW

But what about the high seas, beyond national boundaries?

DW

That is the real Wild West. In terms of the fish being taken, the disputes over whaling, offshore mining, etc., “high seas governance” is becoming an increasingly important and urgent issue. The high seas are part of a holistic earth that we should all respect and govern together, even if they’re beyond our national boundaries. For example, if we allow pollution or overfishing to persist in the high seas, it will come back to us with serious implications for our lives and livelihoods, on the coast and on land.

XW

Do you ever get seasick?

DW

Yes, I usually get quite sick at the beginning of an expedition. It takes about 48 hours for my inner ears to adjust. Mapping a dynamic system like the ocean that is always in motion is challenging. For some people it’s very difficult to read or write during a bumpy car ride or on a fast moving bus or train. It’s similar for many of us trying to function at sea, trying to capture data from a platform that is constantly moving.

XW

The ocean floor moves?

DW

Yes, the ocean floor can be quite dynamic in places, particularly where there are volcanic eruptions, or shifting of the ocean crust at large faults and fissures, but the rate of motion is usually quite slow (fast seafloor spreading is akin to the rate that your fingernails grow). Huge tsunamis result from massive shifts in the ocean floor that are in turn caused by large earthquakes.

XW

Should we rethink what a map is?

DW

Yes we should. Within ocean observatories we’re getting vast quantities of data from shallow mapping systems; growing networks of buoys, sensors, gliders, and other kinds of vehicles; collecting data 24/7 from the ocean surface, throughout the water column and across the ocean floor. Depicting this information overload is forcing us to rethink the notion of a map.

It’s also very challenging to create a communicative map from a constant stream of data. Imagine, for instance, that you’re trying to map in real time all the tweets during a World Cup match. It’s a cacophony of thoughts, opinions, impressions—a stream of noise—so how does one make a decent map of all that? What do we include or exclude? How do we go from something that is stable with its extent, symbology, and colors, to something that is updated constantly, available at multiple scales simultaneously, and where the design of the map can or should be changed instantaneously? This is an exciting, evolving field of research.

XW

But you don’t abandon the core of mapping?

DW

No, we certainly don’t abandon core cartographic principles. In fact, we need those now more than ever in order to make our maps effective at communication. So we still want to focus on the enduring principles of representation: good design, legibility, accuracy, originality, and proper representation of the analytics. Even though just about anyone can make a map, we still need the proper training to make a good map. In a similar vein, we might all have cameras but there is still a great need for the eye and expertise of professional photographers. I believe the same is true for cartography.

XW

Do we know what we don’t know?

DW

In many cases, no. The search for Malaysian Air flight 370 is a good example. This tragedy is showing us how little we know of the Indian Ocean, and in general how little we know about the oceans globally. As the comedian Paul Rodriguez once said: “War is God’s way of teaching us geography.” My corollary to that is disasters are God’s way of teaching us about the oceans. Oftentimes a tragedy or crisis brings to bear the resources needed to map and understand the oceans at the level of detail needed. But if we could do some things without waiting for the next major catastrophe, we would be much better off.

XW

Are crisis and catastrophe compelling us to map the oceans differently?

DW

Not differently in terms of technology, but in terms of detail, yes. In fact, we seem to careen from one crisis or catastrophe to another. In the wake of Hurricane Sandy, the Deepwater Horizon oil spill, the tsunami in Japan, and the typhoon in the Philippines, we’ve been focused on coastal regions. These events indicate that we still have a long way to go before we understand the oceans well enough to prepare for and recover from disasters.

Yet other areas are completely ignored (there is no research funding to map them) because there is no catastrophe happening there at the moment (we think). But even with the Japanese tsunami, marine debris across the Pacific will continue to be a huge problem, as will ocean acidification due to global warming.

XW

Are the polar regions any different?

DW

They are no different in terms of our need to map and understand them. Ironically, with the shrinking of the polar ice caps due to global warming, we’ve recently been able to map portions of the Arctic and Antarctic with less difficulty. But what we learn from these maps should engender more responsible use and protection of those regions.

XW

Is scale a factor?

DW

Yes, the enormity of the oceans brings with it the challenge of the time required to map them, but also forces us to focus efforts. Admittedly, some areas of the oceans are just flat and boring! They’re called abyssal plains and are very easy to map. At the 2012 World Oceans Summit in Singapore, someone rightly suggested that because we can’t instantaneously map all of the oceans, we should focus on active and dynamic areas, including coasts, and just leave the flat, boring abyssal plains alone for a while. We know they won’t change, and we can interpolate in many of those areas.

XW

That’s so funny!

DW

It’s true! It’s the lesser of several evils. Political will is often a major factor in providing research dollars for mapping. The ocean community often compares itself to the space program. It’s extremely expensive to go to the moon, or to run experiments in space, and yet these things were accomplished—spurred in part by the political will of the Cold War. The ocean community is trying very hard to swing political will and public momentum toward better mapping, especially given that it would take a fraction of NASA’s budget. President Obama is trying to engender some political will given the complex realities of climate change, but it’s very frustrating with the current Congress. In the meantime, it seems we will have to wait for the next storm.

Marie Tharp, sitting at her desk at Columbia’s Lamont Geological Conservatory, 1956.
The Ocean Basemap, a cartographic representation of the earth’s bathymetry as contributed by government, university, and industry partners worldwide. This portion of the Basemap shows the western Pacific.
Pisces V is a three-person, battery-powered, submersible, with a maximum operating depth of 6,500 feet.
The panoramic SVII camera pictured is used by Catlin Seaview Survey scientists to create a global baseline of the world’s coral reefs, Galapagos, 2011.
Detail of the Challenger Deep region within the Mariana Trench as portrayed in the Esri Ocean Basemap. Challenge Deep is the deepest spot on the planet at over 6.8 miles. The shallowest regions are indicated in red, moving to deepest regions in purple.
Dawn Wright presenting at Esri’s first annual Ocean GIS Forum, 2013.

Xiaowei Wang is a designer and landscape architect based in San Francisco.

Dawn Wright is an ocean scientist, geographer, and Chief Scientist of the Environmental Systems Research Institute (Esri).